CheckerboardR · Scientific drug-combination analysis
Checkerboard assay synergy analysis
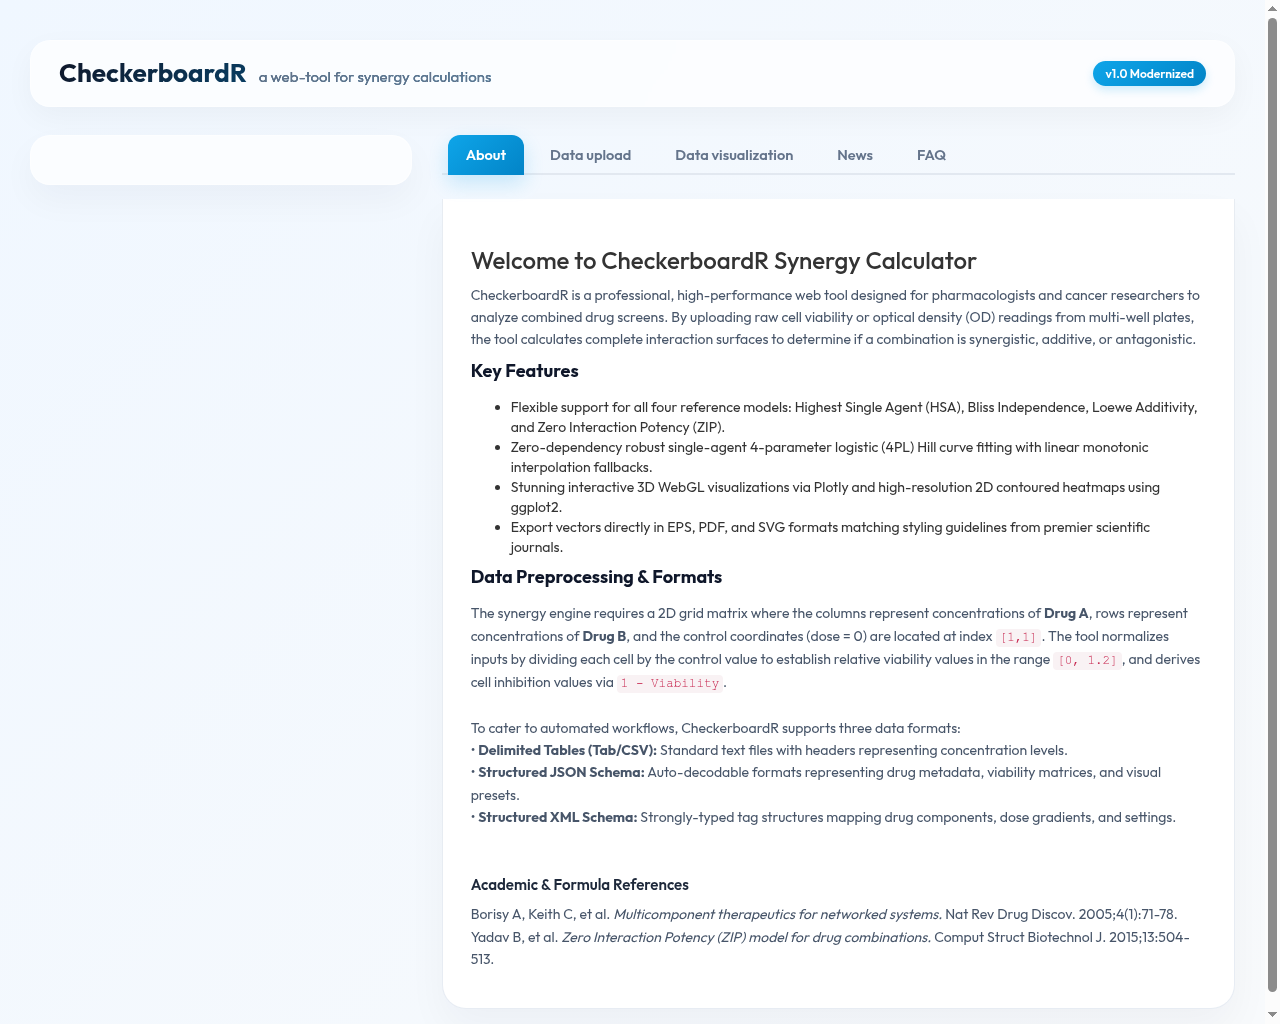
Analyze drug combinations and perform checkerboard synergy calculations for antibiotic, antifungal and cancer studies. CheckerboardR calculates FICI and multiple response-surface models so conclusions are not tied to one definition of interaction.
Supported synergy models
| Model | Question answered |
|---|---|
| FICI (ΣFIC) | At a selected inhibition endpoint, how much are the agents' effective concentrations reduced in combination relative to their single-agent MICs? |
| HSA | Does the combination outperform the more effective single agent at the same doses? |
| Bliss | Does the observed effect exceed the expectation for statistically independent action? |
| Loewe | Does the combination outperform dose additivity relative to the single-agent curves? |
| ZIP | Does the combination change potency relative to a zero-interaction response surface? |
| Consensus | Do the conservative HSA, Bliss and Loewe estimates support the same interaction? |
For FICI, CheckerboardR reports the minimum qualifying value. Following conservative antimicrobial conventions, ≤0.5 indicates synergy, >4 indicates antagonism, and values between those cutoffs indicate indifference. The endpoint is configurable because bacterial, fungal and experimental protocols may use different inhibition thresholds.
Preparing a dose matrix
Columns should represent increasing concentrations of condition A and rows increasing concentrations of condition B. Include zero-dose controls for both agents. CheckerboardR accepts CSV, TAB, pasted tables, structured JSON or XML, and Excel workbooks. Matched matrices can be uploaded as independent replicates for SEM and bootstrap confidence intervals.
Interpreting the scores
Positive interaction scores indicate that observed inhibition exceeds the selected non-interaction reference; negative values indicate antagonism. Magnitude and biological relevance should be considered alongside replicate uncertainty, assay quality, dose coverage and agreement between models. A local high-scoring cell should not be treated as proof without examining the surrounding response surface.
Publication-ready reporting
The application produces labelled 2D heatmaps, interactive and static 3D surfaces, single-agent fitted curves, summary statistics and an auditable CSV containing observed, expected, fitted and interaction-score matrices. Figures can be exported as PDF, SVG or EPS.
Start an analysis
Open the CheckerboardR calculator, choose a bundled example or upload your own matrix, confirm whether values represent viability or inhibition, select the FICI endpoint, and compare the FICI summary with HSA, Bliss, Loewe, ZIP and consensus views.